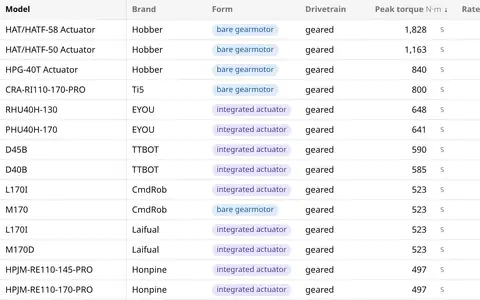
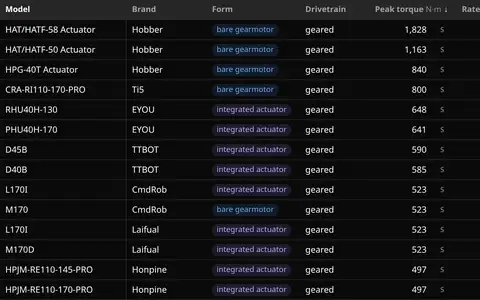
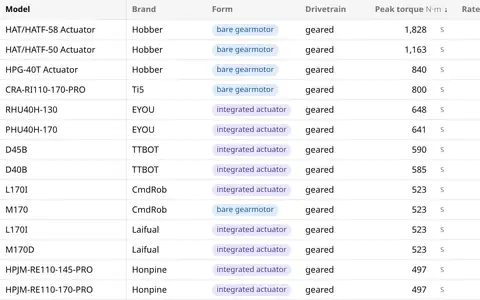
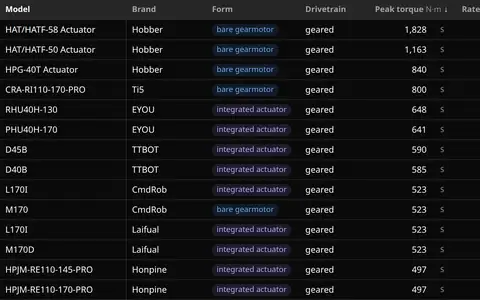
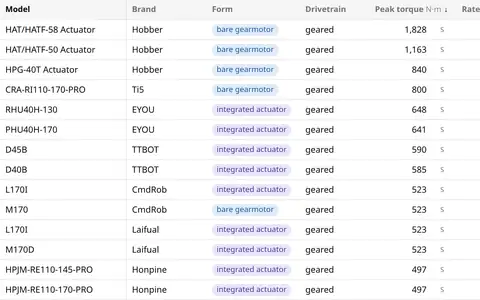
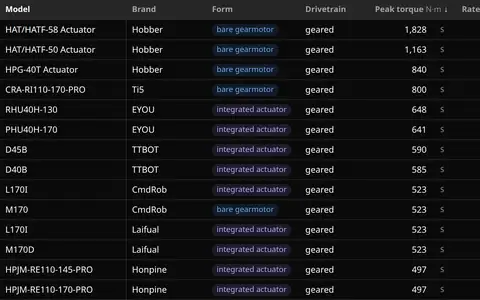
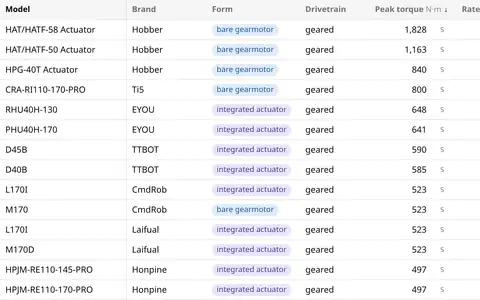
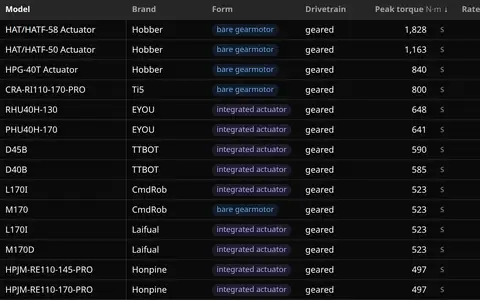
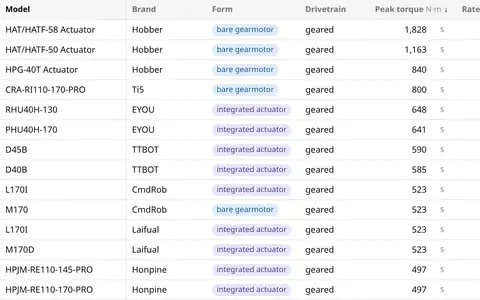
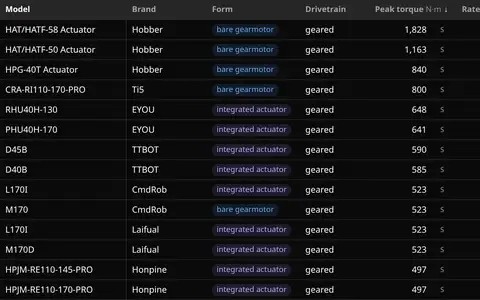
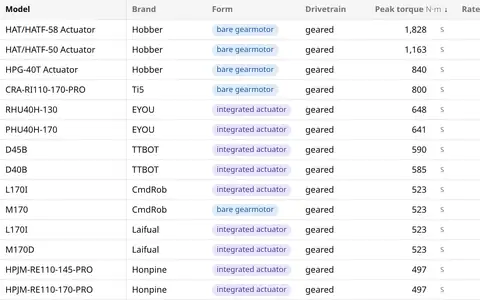
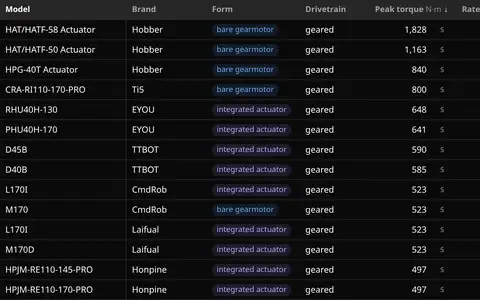
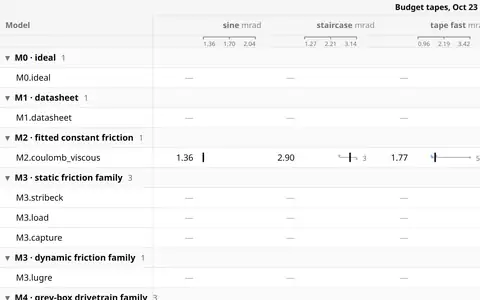
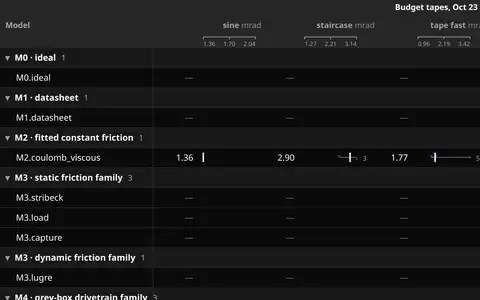
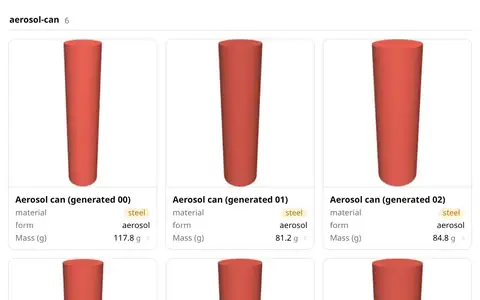
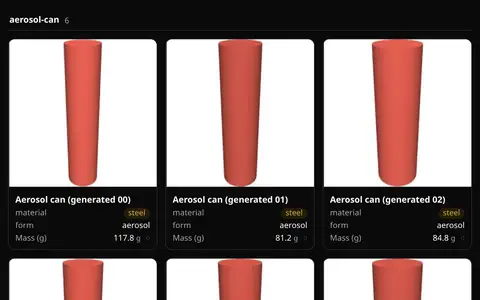
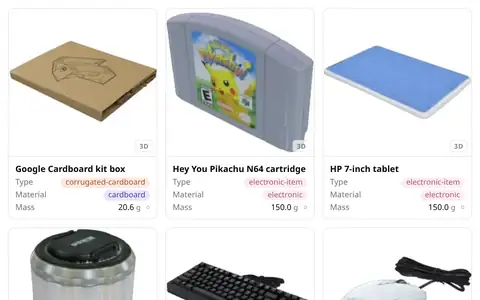
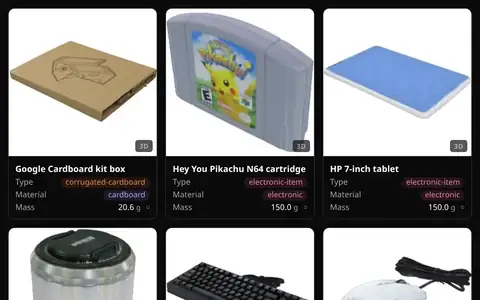
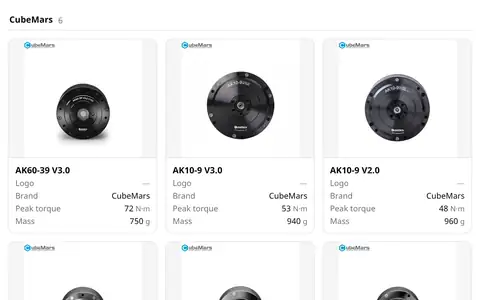
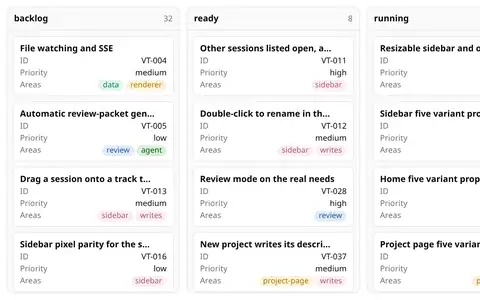
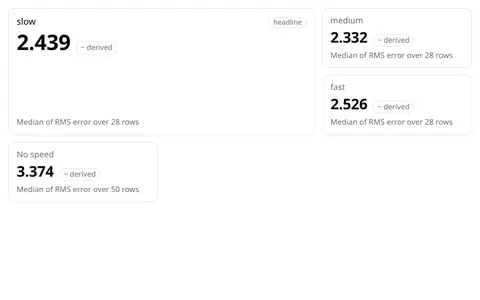
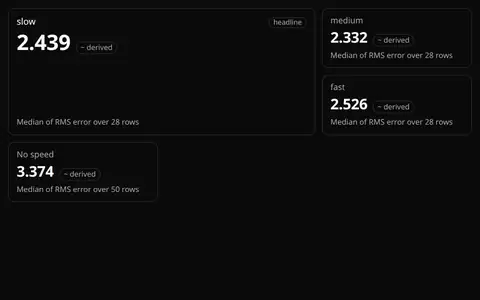
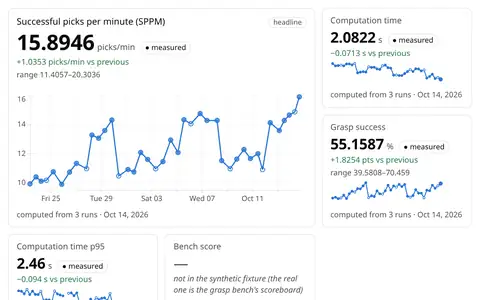
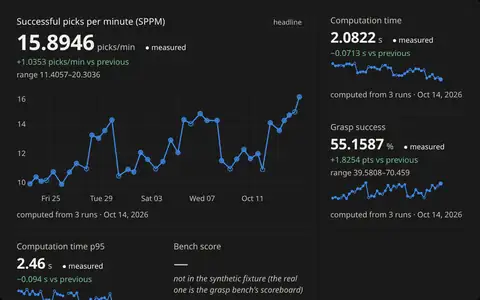
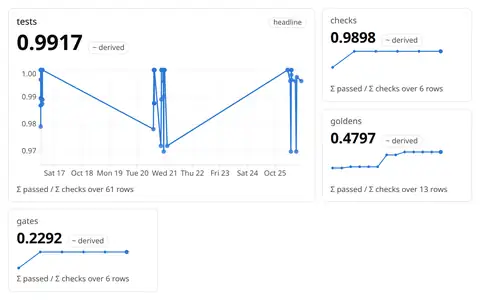
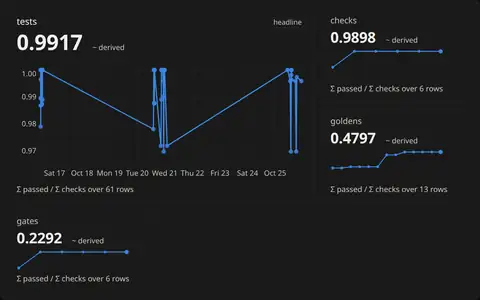
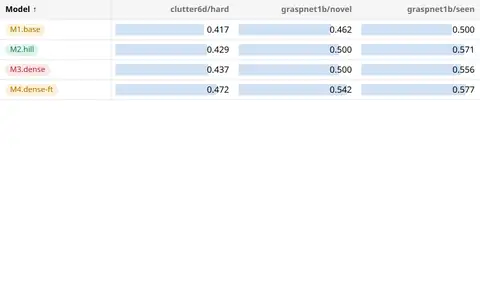
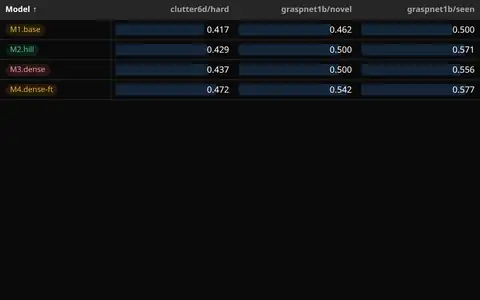
46 cases, each one data file and one .base file from Zach's apps; every picture is the real kit on the real data. Hover a picture to flip through its views.
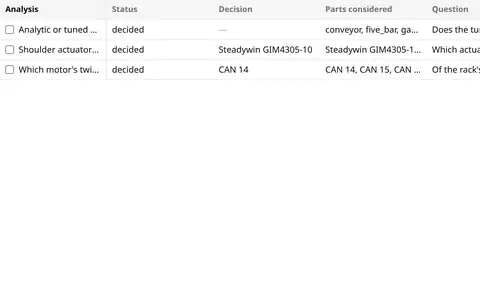
Three analyses, each one Markdown file: prose, ```base fences and ![[x.base]] embeds drawn as live views and
dashboards, a decision callout, and a table of contents from the headings. The list is a data-ui view over their
frontmatter; open one to read it. data-ui's third tier: views, then dashboards, then analyses.
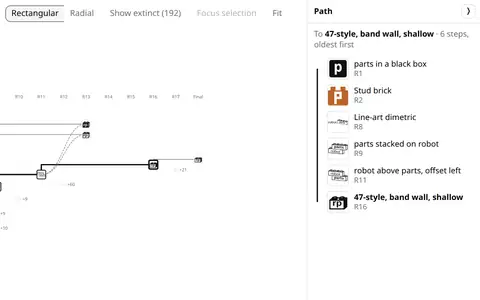
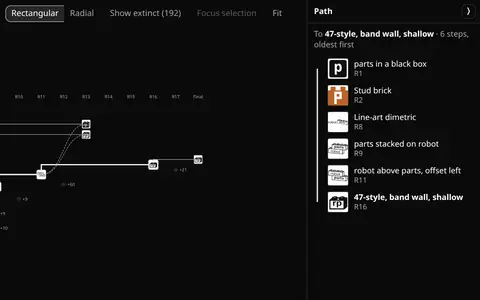
Every logo and brand proposal from Brandbook's four brands as one table of rows, drawn as a tree of life: x is the
round, each proposal hangs off the one it came from, a splice's extra parents curve in dashed, robotparts' shipped
logo (R16-02) and its ancestors are the bold trunk, and the lines Zach never picked or liked thin out or fold into
"+N". Click a mark for its record, its round's reply and where its report lives; the rail's brand, status and score filters thin
the tree like any view.
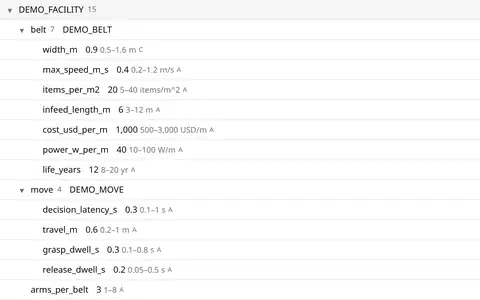
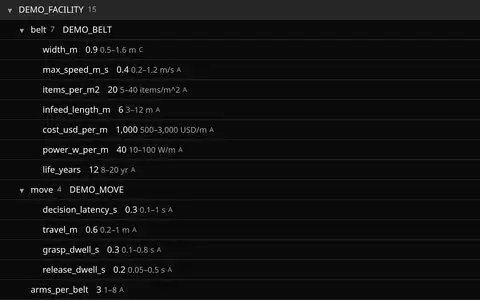
A synthetic facility's inputs, DEMO_FACILITY and the belt and pick move it references (made-up example values,
not real data), as an outline that folds, a sheet per field with its range, basis and source, a form that edits a value inside its range, and the
viewer's Rows table.
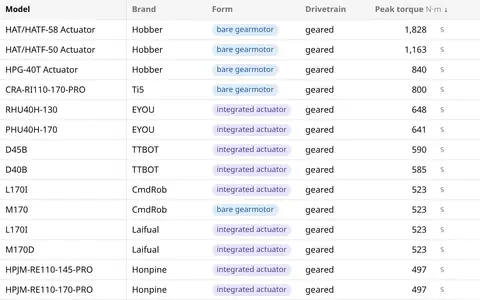
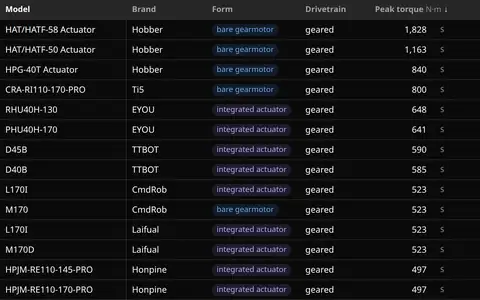
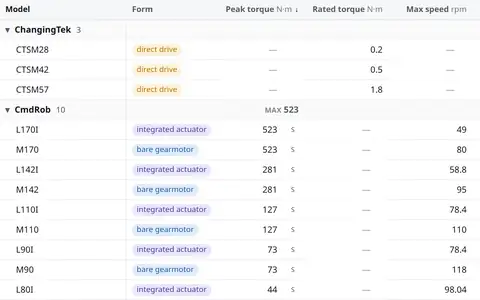
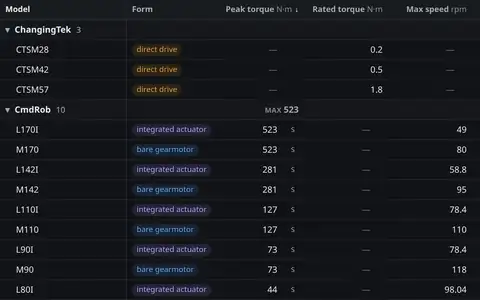
Every standard rail filter kind in one rail, on robotparts' 1,149 actuators: search, popular filters, a form ›
brand tree, McMaster's picture gallery and picture list with line drawings, logo swatches, a values list with
exclude, a toggle, a select, has-a-value, Amazon's price buckets and "& up" rating, a histogram slider and a plain
log slider, ranges with dimension diagrams, a date with "last 7 days" and "older than", tag chips, a compact grid, a
Digi-Key listbox and the current-filters bar. Each one edits the same filter, so the table, the cards and the chart
move together. The McMaster, Amazon, Digi-Key and Obsidian tabs are recipes: a view with its own facets:.
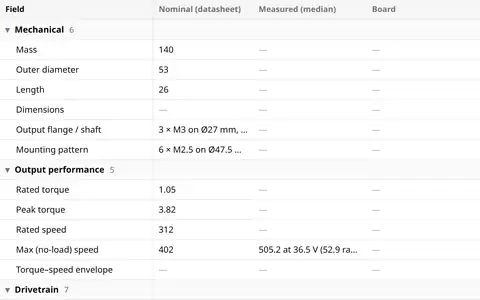
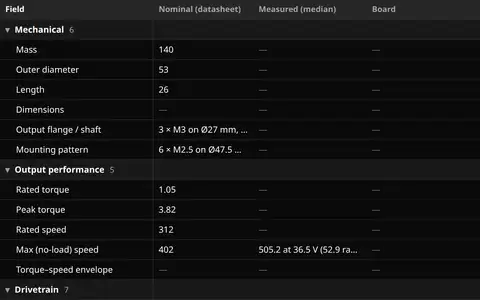
One part, one row per field: what SteadyWin states, what BAM's one-DoF rack measured, what the board reports and
what is derived, grouped by section. Click a value for every value behind it.
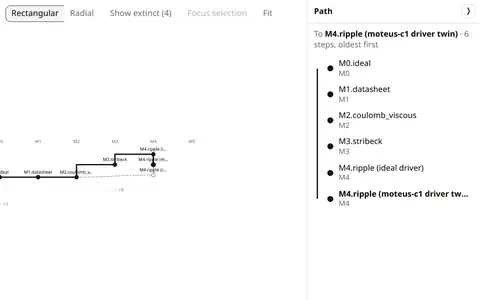
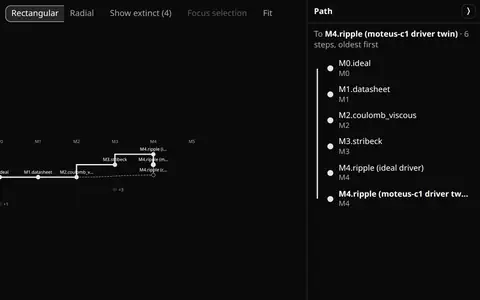
The GIM4305-10 actuator model ladder, M0 to M5, as a tree of life: x is the rung, each model hangs off the model it
adds physics to, the c1 soft-friction twin splices in M2's soft friction, the four models with bench runs stay alive
and the five with none fold into "+N". Labels instead of pictures: the same lineage view as the brand case, over
another kind of data.
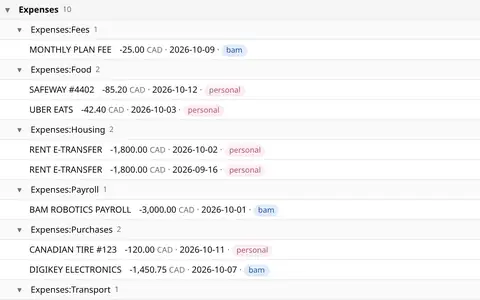
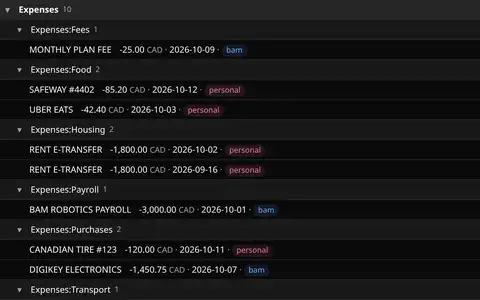
Transactions grouped by kind and category, a table with a sum per category, the same rows by entity, and a form that
recategorises one. Illustrative rows only: money's synthetic test fixture, never real account data.
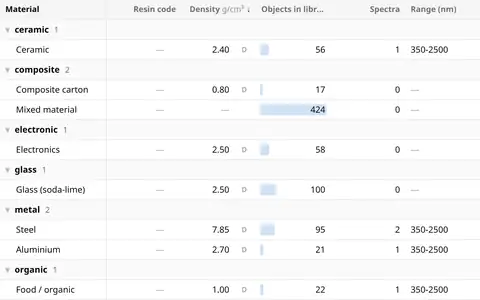
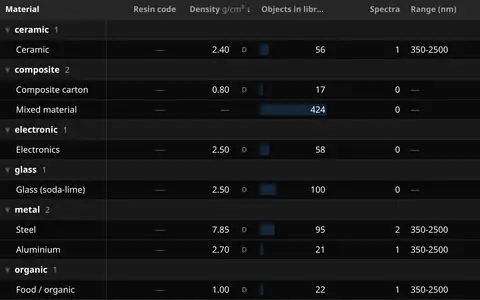
Material-first: materials with their density and measured reflectance spectra, and every object placed by what it
is made of on an Ashby chart (mass against bounding-box volume). 3D shows only in an object's peek.
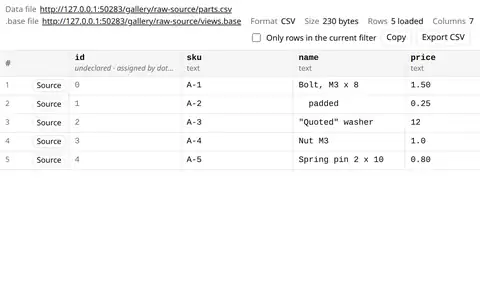
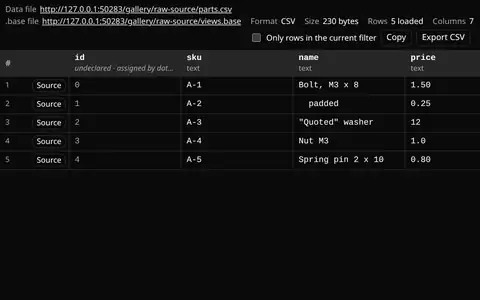
The data behind the views as a plain grid, for debugging: every key of every row, each value exactly as stored, and
a row's record as it sits in its file. Here a small CSV carries the values that usually go wrong between a file and
a view, and the table beside it shows the same rows as the kit normally draws them.
Every actuator in robotparts.dev's catalog (1,149 rows, release 2026.10.25) in one .base file: seven tables, a cards
gallery of the 150 photographed parts and two pivots over the same rows, with the McMaster rail on the left. Tick a
brand and every view reads the same rows.
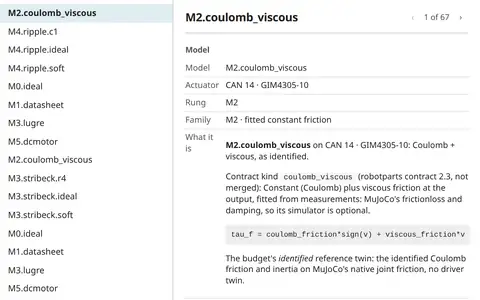
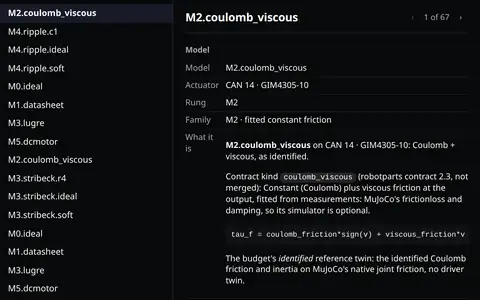
One actuator model's own page, the one every model name in the models case links to: what the model is (its
robotparts contract 2.3 kind and equation, what the twin actually runs), its error on each bench, its fitted terms,
the commit the rack's twin code was fitted with and that code's README at the commit, rendered as markdown.
Configuration only: a record view and a table over the models case's data file, the model picked by the rail.
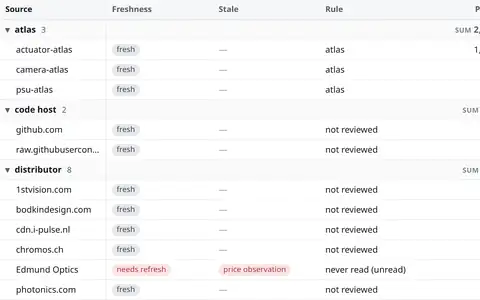
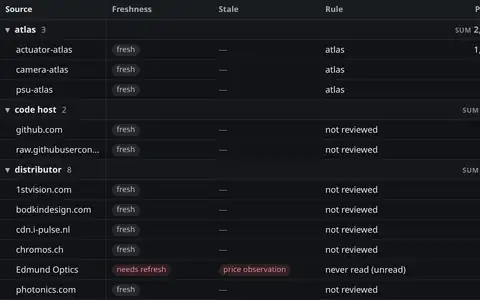
Every source robotparts.dev holds an asset from, grouped by kind, with a stale badge where an asset or a link check
has aged past its kind's threshold: the freshness table, in a .base file.
robotparts' 1,149 actuators under toolbar="bar": one row with the view chip (or tabs), the table's own query bar,
the filter control and Display, then the filter pills or the bulk bar. Every variant is an attribute of the element
(docs/CONTRACT.md §15).
The same 1,149 actuators under toolbar="bar" views="tabs" filters="pills" promote="" display="panel": every view a tab (the
ones that don't fit fold into "N more…"), compact filter pills under the bar, and Notion's View settings as a
resizable side panel. Zach on the two apps: "Notion has compact filters and spread out views."
The same 1,149 actuators under toolbar="bar" views="dropdown" promote="sort group filter properties" display="panel": Bases' view chip
(its chevron lights on hover; its menu has a find box, a ✓ on the current view and Add view), then Sort · Group ·
Filter · Properties as words that say what is set ("Sort: Peak torque"). Zach: "obsidan has compact views and spread
out filters".
robotparts' 1,149 actuators with the bar's query box in token mode: type brand: and it suggests the brands with
their counts, Enter makes the clause a token, and a tick in the rail shows up as a token too, because both edit the one
filter. Shift-click a range of rows, ctrl-click to add one, and Shopify's bulk bar offers Compare, Copy IDs and Export
CSV (docs/CONTRACT.md §15).
The same 1,149 actuators under toolbar="bar" views="dropdown" promote="": the bar is exactly three elements, as
Shopify admin's index tables are: the saved-view chip on the left, the search box, and Display on the right, which holds
everything else (layout, frame, properties, filter, sort, group). Select rows and the bulk band takes the column header
row's place, tinted, with "N selected", the actions and "Show only selected".
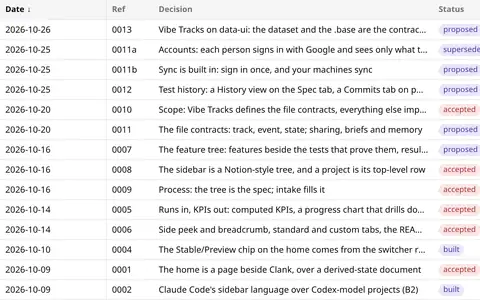
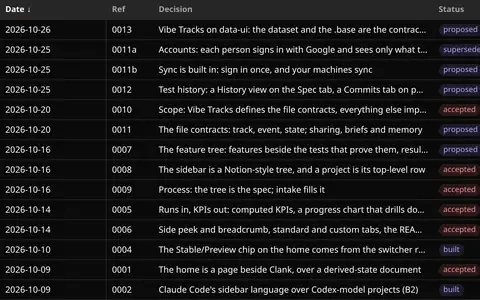
Vibe Tracks' fifteen decision records (its PEPs 0001 to 0013, with 0011a and 0011b), newest first, and the tree of
what each one depends on: an edge only where a record names another in its header (builds on, amends, supersedes).
The same rows and edges drawn by both graph engines: React Flow to pan and zoom, Mermaid as a static map. Click a
decision for its record.
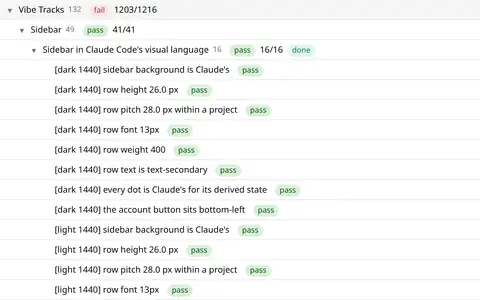
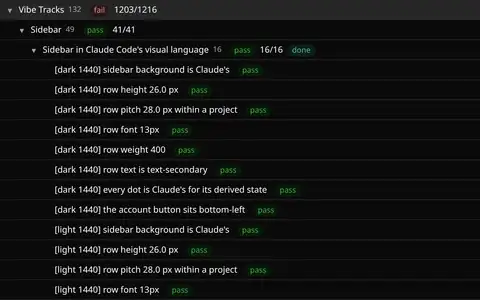
Vibe Tracks' own spec: each feature note under its area, the tests that prove it under the feature, and every state
computed from the latest runs (pass, fail, not run yet, no tests), a failure rolling up to the track. An outline that
folds, a "Failing" preset, a table of features by note status, and a page per node.
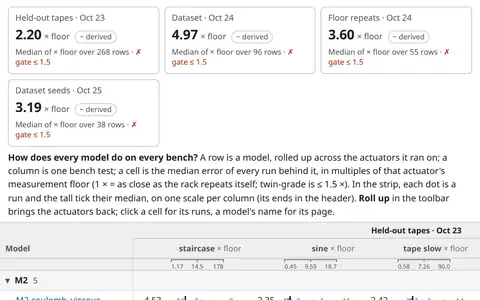
The rack comparison Zach keeps rebuilding: every friction and drivetrain model of the GIM4305-10 (CAN 14) scored on
the bam-rack/1 suite by its twin's joint-angle error, q RMS. The pivot is models × tests with each cell's median and
spread; two charts put every run, and each model's median, against the twin-grade lines (held-out error at most
1.5 × the 1.08 mrad floor, 1.62 mrad, and at most 2.16 mrad in every motion class). The chart shows the report's
verdict at a glance: M4.ripple with the moteus-c1 driver twin sits at about 1 × the floor on the Oct 23 tapes and
at 8.2 × on the Oct 24 cycle runs, so no model is twin-grade yet.
Every actuator model BAM's rack has scored, one file of configuration: the model × bench pivot first, then the
leaderboard and the parameters, as tabs of one .base. Each tab opens with its answer (KPI cards and how to read it),
rolls up across actuators by default (Roll up in the toolbar brings them back), and links every model to its own page.
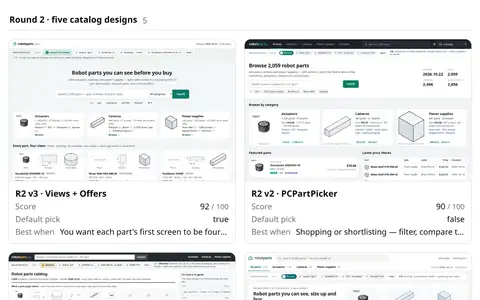
The ten robotparts.dev design proposals from the two babbles of 2026-10-22 (five design languages, then five catalog
designs) as cards with their stills: each card the proposal's landing page, its weighted score out of 100 and when
it wins; open any still full screen and arrow through the rest. Other views show every still per proposal and the
phone layouts side by side.
Every SVG from robotparts' eleven logo rounds of 2026-10-25 (203 files) as one media grid: grouped by round, each
card the logo with its name, kind and the round's score out of 35; click a logo for the lightbox, then arrow through
all of them. Other views rank the lockups by score and lay out the favicon marks.
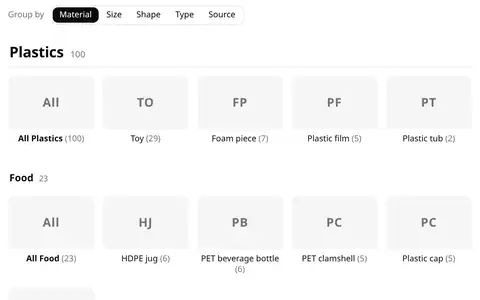
BAM's object library as a catalogue home, the way McMaster-Carr and a Shopify collection lay one out, over its public
sample (366 objects): a big title per material with its count, a second heading only where the data has one (Plastics,
Glass and Paper split into Medical and Food; Metals has no second layer), and inside each a tile per type with its
count. The left rail filters to one group and gives every group back when clicked again; the switcher regroups the
same rows by size (bins of the bounding-box volume), shape, type or source, and the rail follows it.
Table-first, and no new view design: the .base files object-db bases already writes (all but Customers, which is private) for Obsidian, read by
data-ui. Each needs two edits (a data: line added; the file.inFolder(...) clause commented out, because a data
file has no vault folders), and Types.base a third (its backlink formula becomes a precomputed column). The peek adds
the 3D orbit viewer on its own, from the field's media: mesh.
Gallery-first: BAM's object library as cards, each the library's own poster render, the object's real mesh turning
under the pointer. One WebGL renderer serves the whole page (at most 4 models animate at once), so 409 or 2,454
cards cost images until someone hovers. The rail is the library's six orthogonal axes plus where the geometry came
from; the peek opens on an orbit viewer.
175 of robotparts.dev's actuators and cameras as cards with their real hosted photos and their brands' logos, one
.base file: actuators and cameras grouped by brand, a photo wall, and the table over the same rows. Click a photo
for the lightbox; its caption says where the photo came from and when it was fetched.
Vibe Tracks' 76 feature notes on a kanban board: one column per vibe-status, in Vibe Tracks' own order, each with
its count. Drag a card to another column to propose a new status; drag a column header to reorder the columns, which
rewrites the view's groupOrder. The proof board groups by a derived property, so its cards stay put.
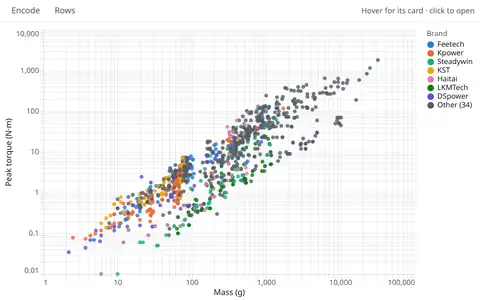
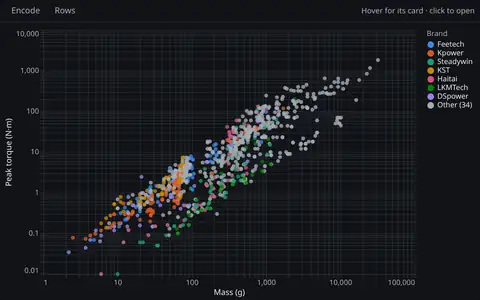
robotparts' 1,149 actuators as chart presets in one .base file: peak torque vs mass coloured by brand, an Ashby
chart with a filled envelope per drivetrain and a constant N·m-per-gram index line, torque density, price vs torque,
small multiples by form and median torque by brand. Tick the rail and every chart redraws; hover a dot for the
part's photo and values; click it for the record.
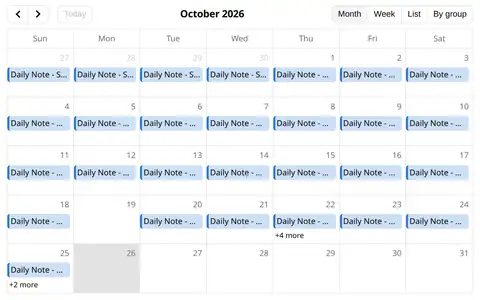
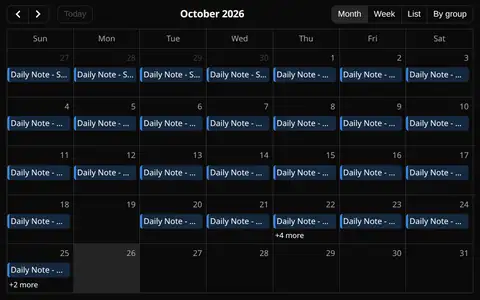
robotparts' release tags and the dates of Zach's daily notes on one calendar: a month grid, a list, and the
latest release week. Only file names and frontmatter dates are read from the vault, never a note's text. Drag an
event to another day: the view proposes the new date to the host, and this page (site.json: editable) applies it
in memory; a read-only page refuses and the event goes back.
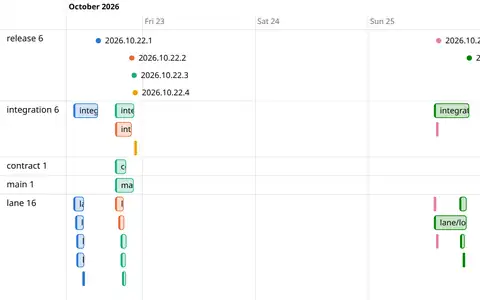
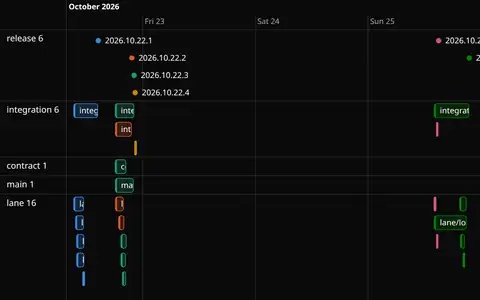
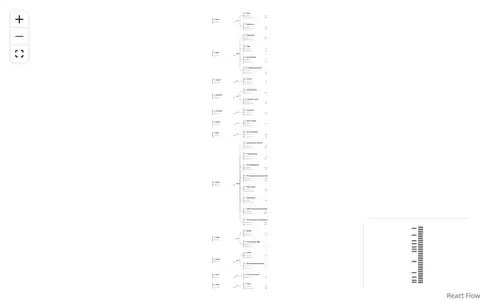
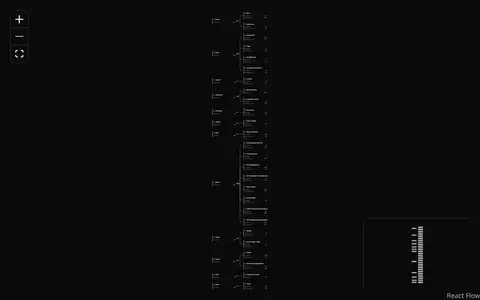
robotparts' six releases from 2026-10-22 to 2026-10-25 and the 24 branches merged into them, from git: a release
is a point at its tag, a lane, integration or contract branch is a bar from the first commit its merge brought in
to the merge. Lanes by kind, coloured by the release they shipped in; or by release, nested by kind.
pidtuna's four-rung tuning ladder (factory → analytic → tuned → oracle) on nine simulated robots, as one dashboard:
how close the tuned gains get to the oracle per robot, gains against the error they buy, the error per rung, every
joint and motor, and the one real check (the sim plant against the rack's servos).
The rack's eight motor twins against the real motors on one page: twin error against the measurement floor per motor,
the model ladders (which modelling rung buys how much), the twin's error run by run, the improvement rounds, and
every model-card term. Click a motor anywhere and every panel shows only it.
Target vs sim vs real error summaries on one page: real rack runs against two twins per motor, speed and trajectory
kind; the 10-09 study of target vs sim per joint (its real slots were never run, and say so); and the traj_compare
reports that hold the curves, linked rather than redrawn.
Vibe Tracks' home as one dashboard: every real track with its headline KPI and history, the check runs rolled up
through child tracks, and the newest runs. Three linked datasets in one .base file; one rail for all of them; a click
on a card, a bar or a track narrows every panel.
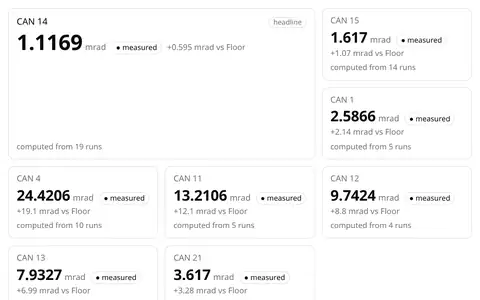
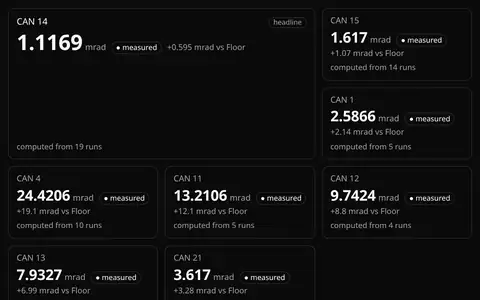
Vibe Tracks' KPI section rebuilt from one .base file: the headline SPPM card with its run history, the smaller
cards beside it (computation time, grasp success, p95, bench score), filled marks for measured readings and hollow
ones for estimates. The history is a chart view (Vega-Lite), so the page has one chart engine.
The run is the atomic record; the cards, the chart, the leaderboard, the table, the pivot and the grouped table are
views over that one dataset. A ratio-of-sums KPI per run kind, every run over time, and a leaderboard that is the
track tree's roll-up.
Runs as rows, the way an experiment tracker keeps them: each run's model and parameters (environment, lane, bench
version, round) and its metrics (attempts, successes, compute, success rate). A leaderboard pivot, the metric
against the step per environment, one KPI card per model with its pooled success rate, and the runs table, all from
one .base file. Illustrative data: Vibe Tracks' synthetic grasp bench, made-up models.
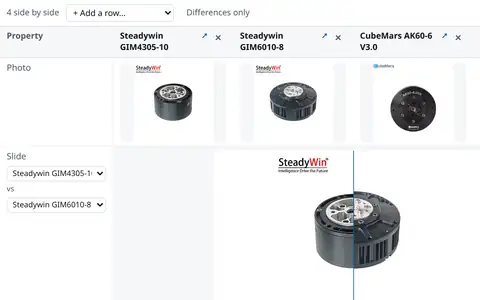
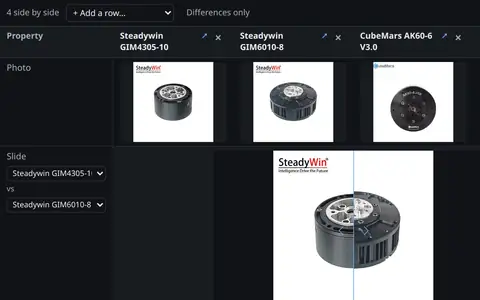
Four integrated actuators from robotparts.dev's catalog in columns, one line per spec: the better value of each spec
marked by its direction, "Differences only", the robotparts photos in a slider, and a column you can drop or add from
the six in the file.
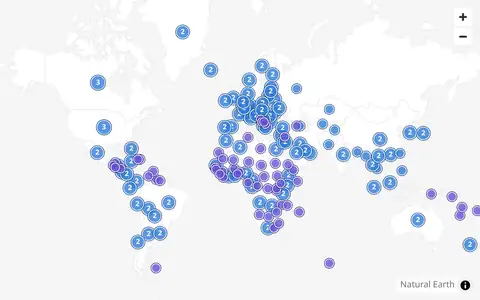
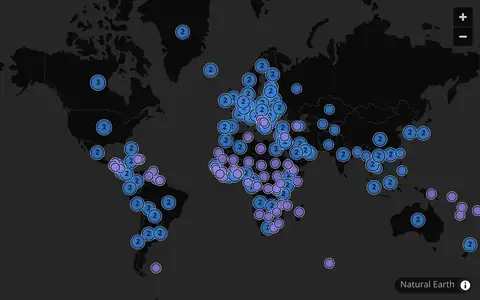
Where robotparts' sellers are based and where they ship, from what each seller published with its listings
(seller_country, ships_to). Markers sit on the country's Natural Earth label point; rows at one point count
together and a counted marker lists its rows. The basemap is bundled: no tile server is asked.
Taxonomy-first: the library as its own structure, family → material → type, every node with its library-wide
instance count. A graph (React Flow) and an outline (the table's tree); a type's peek, and the prototype page's
full-height stage, show its representative object in 3D.
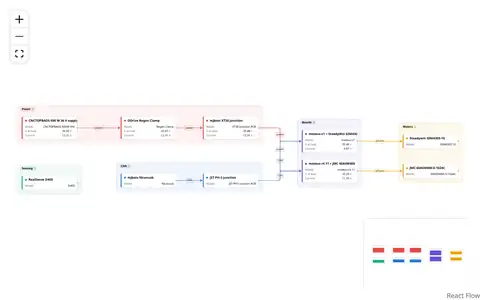
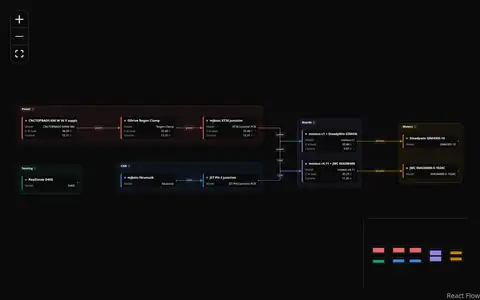
The parts of BAM's one-DoF test rack as a graph: the supply, regen clamp and XT30 junction feed the two moteus
boards, the fdcanusb and PH-3 junction carry CAN to them, each board drives its motor, and the D405 sits beside it.
Power, CAN and phase wires each keep their own colour; click a part for its ports, cables, Splice's voltage and
current at load, and its findings.
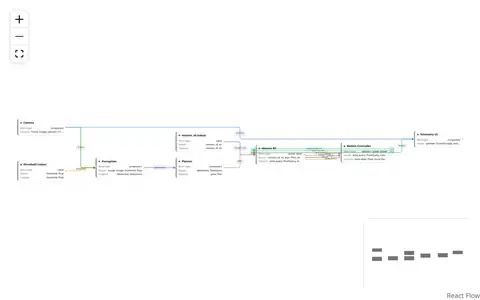
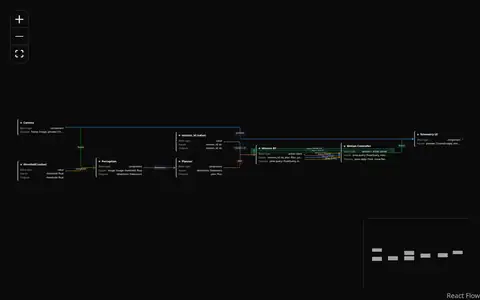
One SystemSketch board, the communication-projection prototype (camera, perception, planner, mission behaviour
tree, motion controller, telemetry UI and two value blocks), as rows plus edges: a block is a row with its input
and output ports, a connection is an edge named by the output port it leaves. The mission BT and motion controller
keep all six of their connections, each with its own line and label.